
Value & ROI
Value that is measured in the platform, not asserted in a deck.
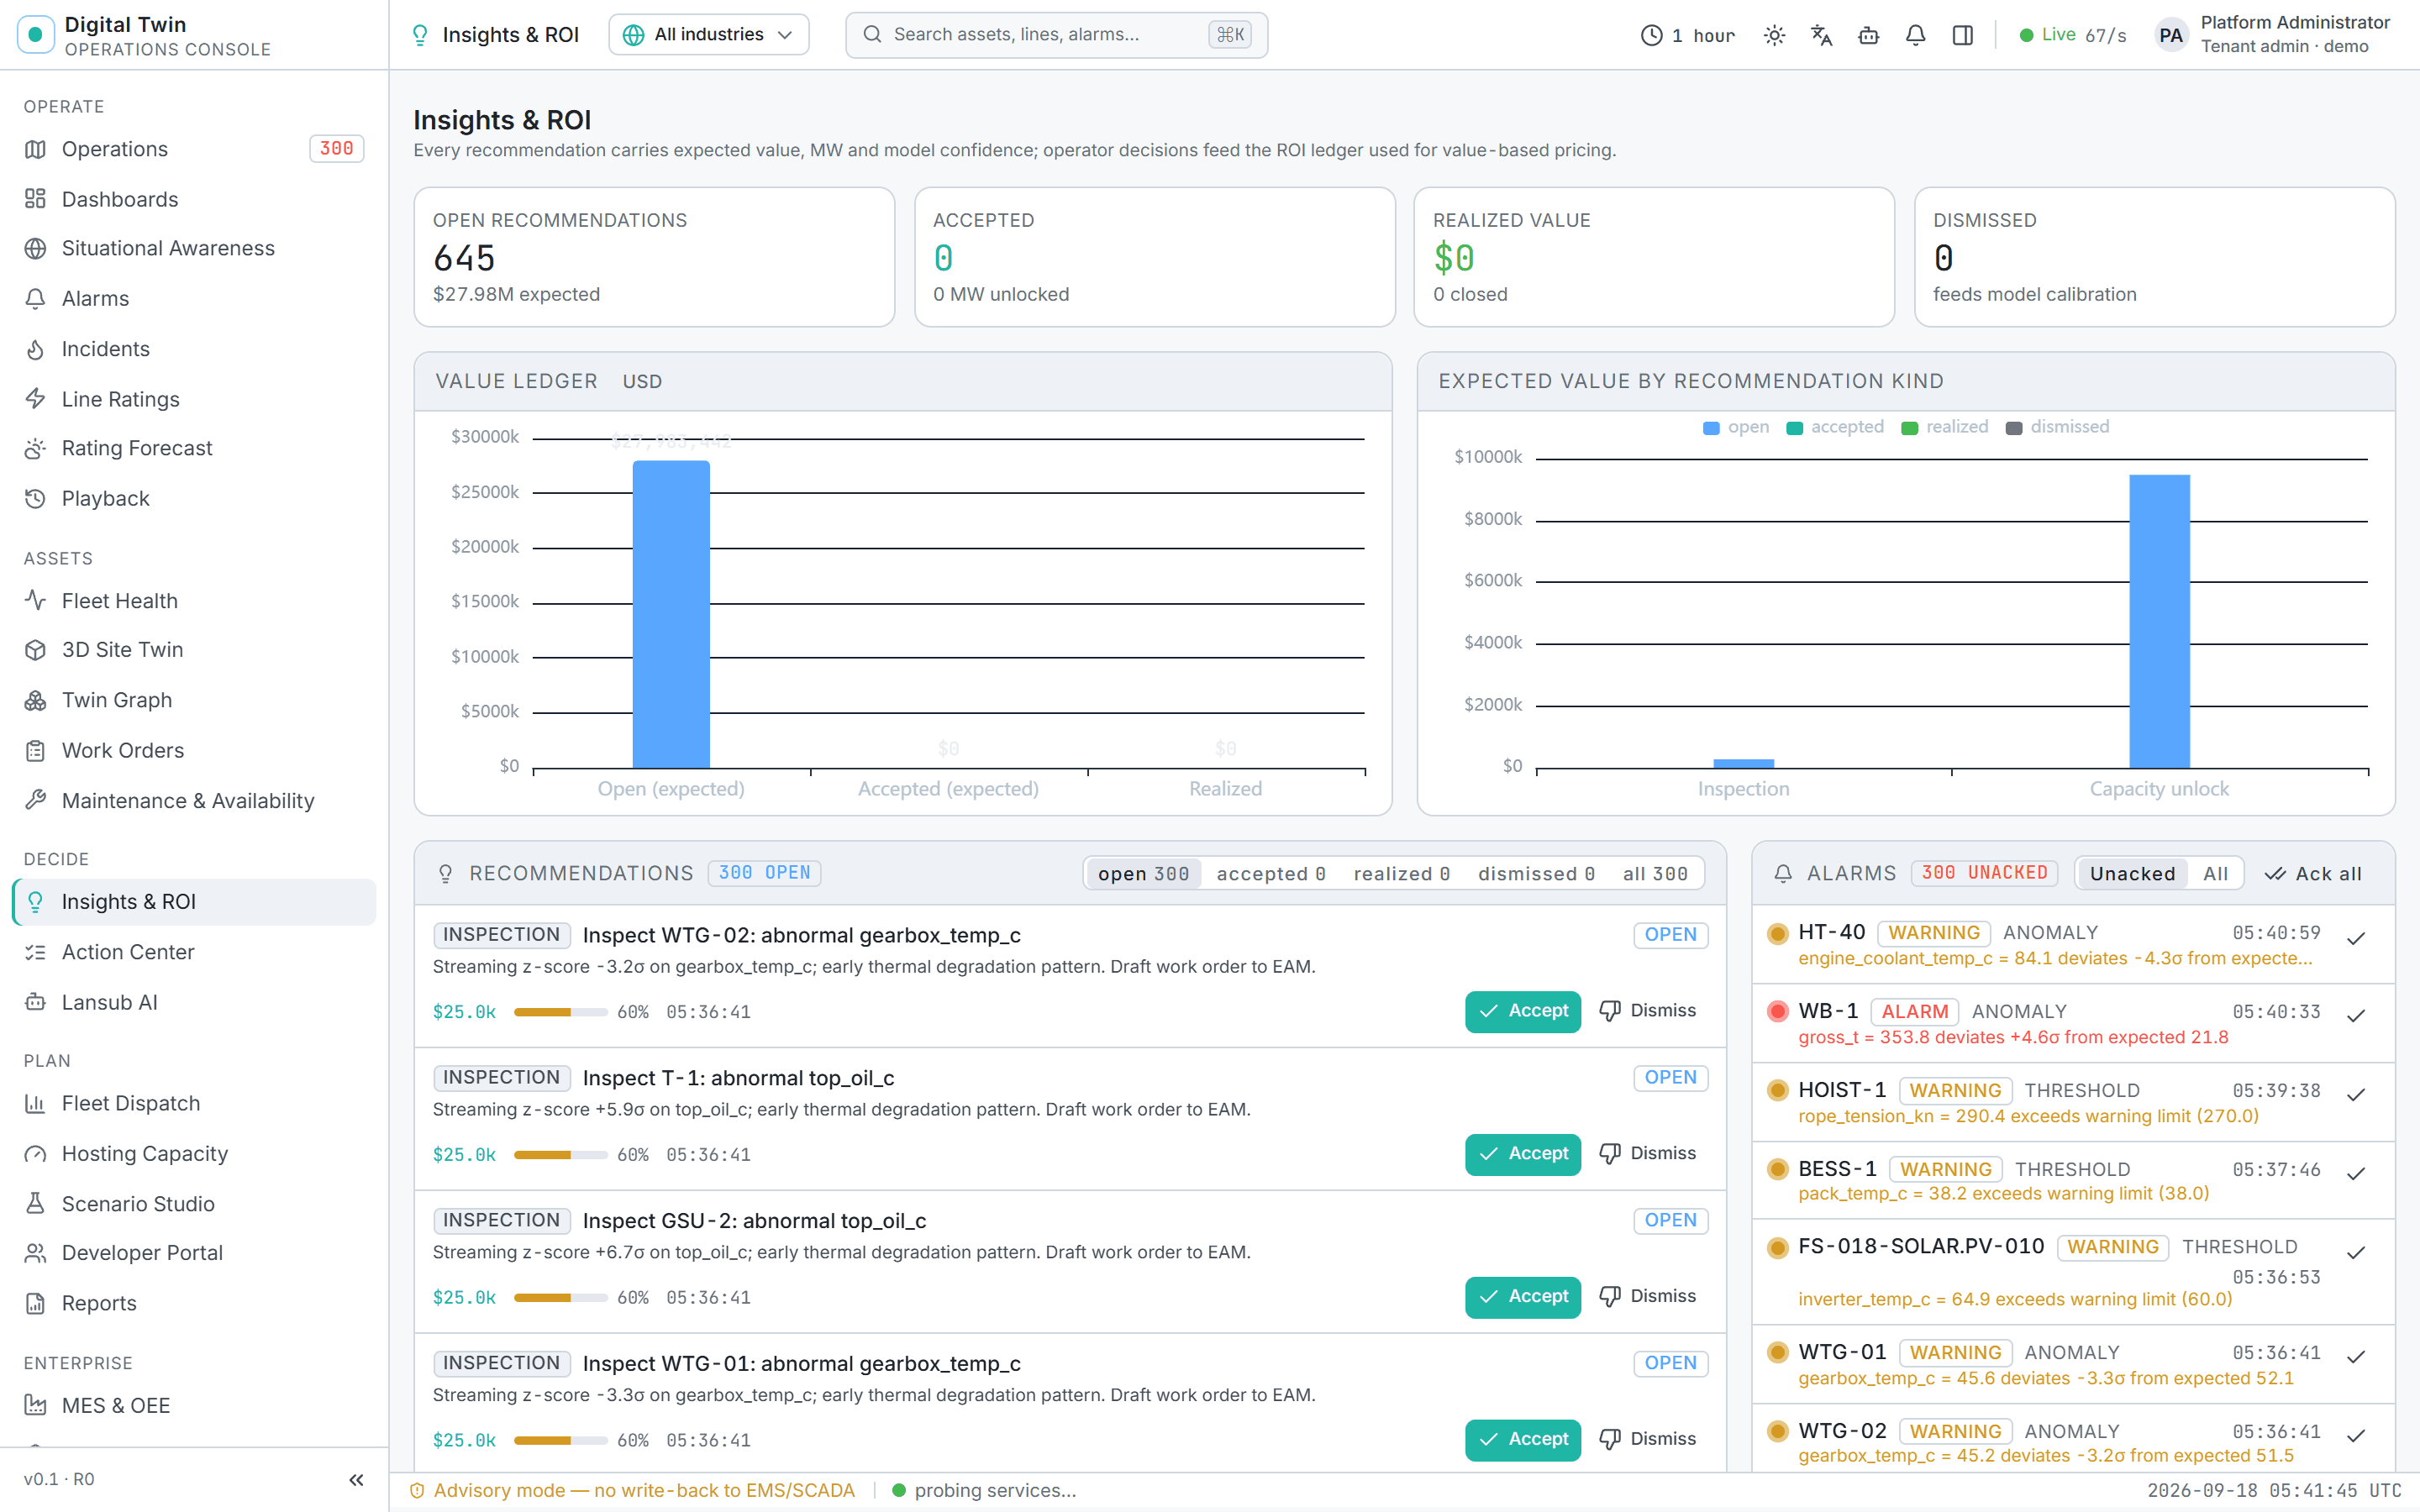
Every recommendation Digital Twin makes carries an expected MW, an expected USD and a confidence. When the operator acts, the realised value is booked against it. This page explains the five value streams, shows the reference figures we design against, and lets you estimate your own case with the same formulas.
Reference outcomes
What the industry has demonstrated.
These are published results from comparable technologies, not Digital Twin customer claims. We use them to size pilots; the pilot then replaces them with your numbers.
more line capacity from software-only dynamic ratings
GE Vernova reference
renewable curtailment reduction in a UK DLR demonstrator
IJEPES citation
less downtime and up to 5-year life extension with fleet PdM
GE Digital Wind Farm reference
pilot time-to-value on your own telemetry
Digital Twin pilot design
Five value streams
Where the money comes from — and how each one shows up in the product.
Capacity unlock
Dynamic line ratings raise the dispatchable limit on the hours weather allows. Value = extra MW × congested hours × congestion price.
Measured by
expected_mw · expected_value_usd on every CAPACITY_UNLOCK recommendation; realised value when the limit is used.
up to 33 % capacity · ≈ 56 % curtailment reduction
Avoided downtime
Physics-informed health indices and streaming anomalies turn calendar maintenance into condition-based work orders.
Measured by
INSPECTION / MAINTENANCE recommendations with avoided-cost estimates; work-order closure findings.
25 % less downtime · up to 5-yr life extension
Deferred capital
Knowing true transformer ageing (IEEE C57.91) and line headroom defers reinforcement and replacement decisions with evidence.
Measured by
Health index, RUL and loading history per asset in Fleet Health and Reports.
2–4 yr transformer lead times make this the scarcest capacity of all
Faster interconnection
Feeder hosting capacity and IEEE 1547 screening give developers an answer in the portal; the queue tracks stages against SLAs.
Measured by
fits / conditional / upgrade decisions per application; stage SLA compliance.
interconnection queue: the #1 grid bottleneck
Compliance & audit effort
Hash-chained ledger, retention tiers and evidence exports replace manual timeline reconstruction.
Measured by
Ledger entries per period; export packs generated.
FERC 881-style evidence for ratings
Estimator
Estimate your annual value.
Move the sliders. The formulas are the ones the platform uses for expected value (default USD 12 per MWh of congestion relief) and the downtime model used in fleet pilots. Results are illustrative until replaced by your telemetry.
Capacity unlock (DLR)
Avoided downtime (fleet health)
Illustrative annual value
- Capacity unlocked
- 864 MW
- USD 9.33 M / yr
- Outage hours avoided
- 324 h
- USD 1.46 M / yr
- Total
- USD 10.79 M
- per year, before subscription
Formulas mirror the platform's ROI ledger: value = MW × hours × USD/MWh; downtime = assets × events × hours × cost × reduction. The 90-day pilot replaces every assumption here with measured numbers from your telemetry and recommendations marked realized.
Proof
From expected to realised, in the ledger.
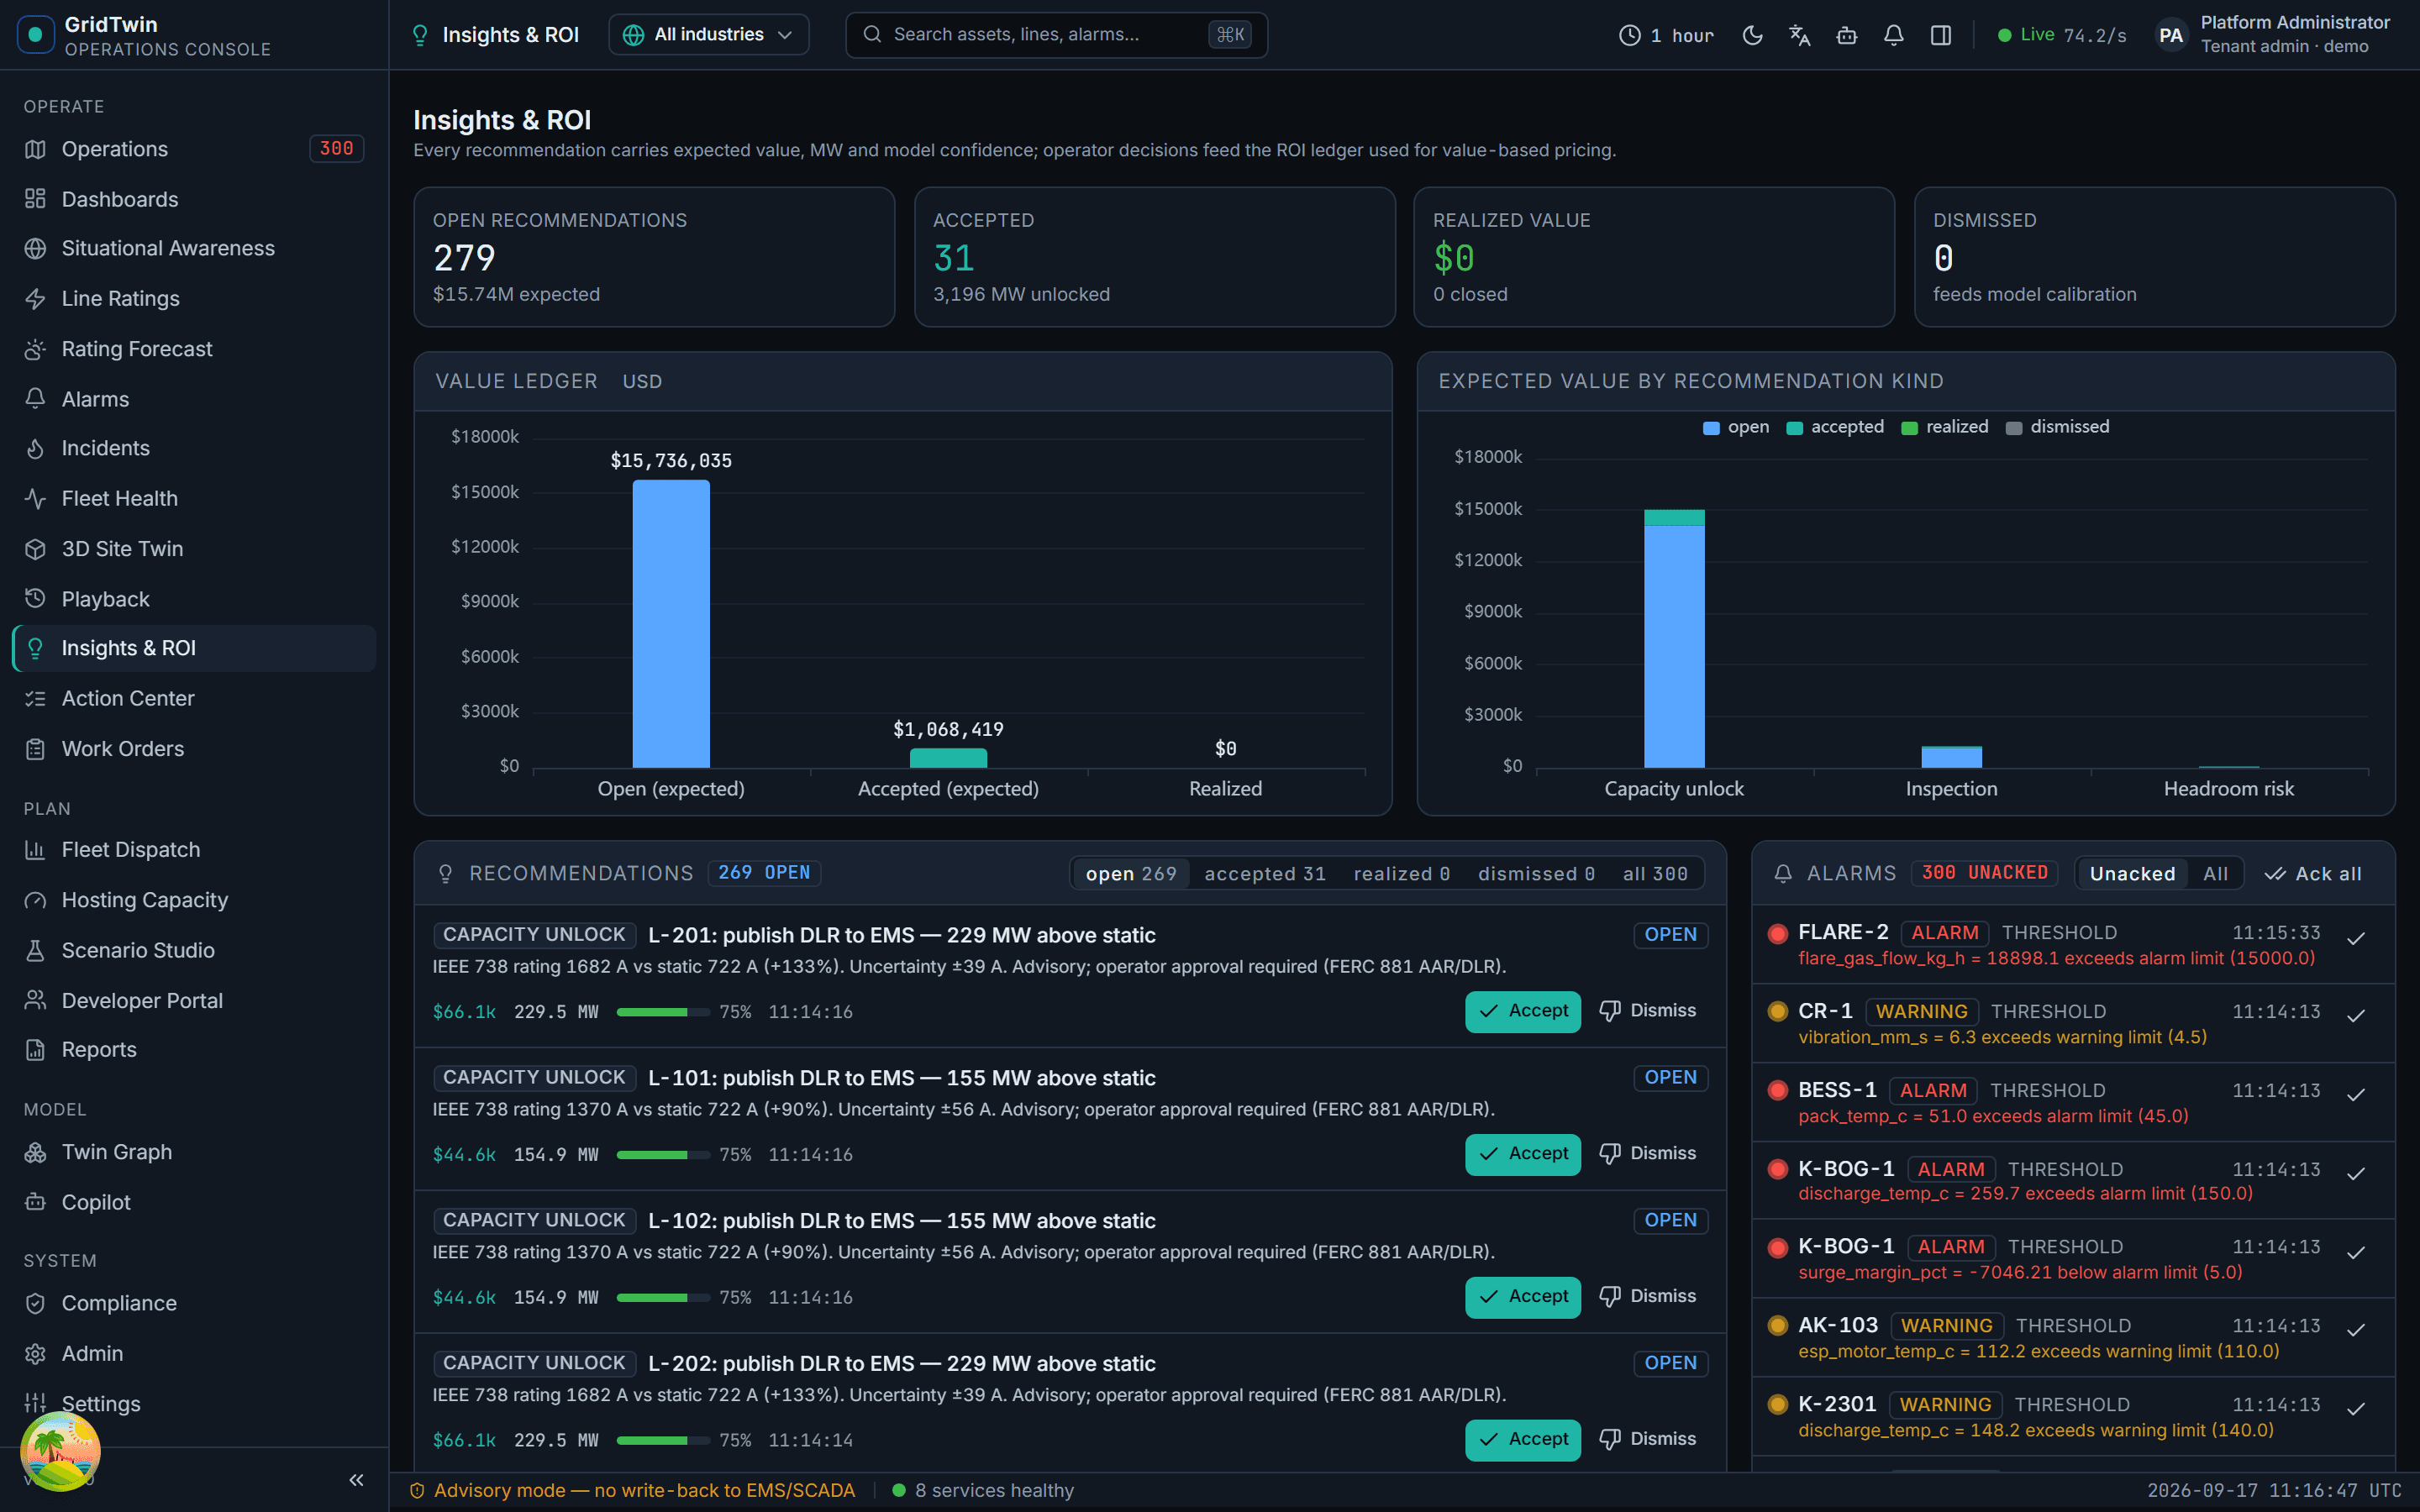
Recommendations move through open → accepted → realised. The ledger hashes every step, so the ROI you report to a board or a regulator is backed by an immutable record.
- reco.accepted by operator@…L-201 CAPACITY_UNLOCK +38 MW45384540f…
hash = sha256(prev_hash | ts | actor | action | subject | detail)
Compared with
Where Digital Twin sits among the alternatives.
Honest positioning. Many of these are excellent products; Digital Twin is built for energy operators who need operational outcomes at mid-market cost and on their own perimeter.
PLM / engineering twins (Siemens Xcelerator, Dassault, Ansys, Bentley iTwin)
Operational, streaming-first: seconds of latency, actions and ledger — not design-time geometry.
Hyperscaler twin toolkits (Azure Digital Twins, AWS IoT TwinMaker)
Energy physics and workflows in the box; deploy in your cloud, on-prem or air-gapped.
OEM APM suites (GE Vernova APM/GridOS, Hitachi Lumada, ABB Ability, Schneider EcoStruxure)
OEM-neutral models, open CIM ontology, mid-market pricing and outcome-tracked ROI.
Industrial DataOps (Cognite, AVEVA PI, C3 AI, Palantir)
Opinionated for energy: DLR, hosting capacity, interconnection and compliance packs work on day one.
Product names are trademarks of their respective owners.
Turn the estimate into a measured number.
A 90-day pilot on one corridor or one fleet, with the ROI ledger switched on from day one.
References for figures on this page
- IEA grid investment outlook (via IBM Institute for Business Value).
- GE Vernova — software-only dynamic line ratings: up to 33 % additional capacity; significantly lower cost than sensor-based DLR.
- IJEPES — UK dynamic line rating demonstrator, ≈ 56 % curtailment reduction.
- GE Digital Wind Farm — 25 % less downtime, up to 5-year life extension.
- DOE iQMS / Lawrence Berkeley National Laboratory — interconnection queue statistics.
- Verified Market Reports — energy & utilities digital-twin market USD 9 B → 36.9 B (19.7 % CAGR).
- IEEE Std 738-2012, IEEE Std C57.91-2011, IEC 61400-12, IEC 61724, ISO 10816-3, IEC 62271, IEEE 1547.